 David Roller is the founder and President of Profit2. There is a strong correlation between how you price low-volume, infrequently purchased incidental items and your overall profitability.
Although the definition of “incidental sale” varies by industry, for the purpose of our study we defined incidental sales as an item a customer buys 3 or less times a year and on which they spend less than $250 total during a year.
25% of Distributors Earn Far More
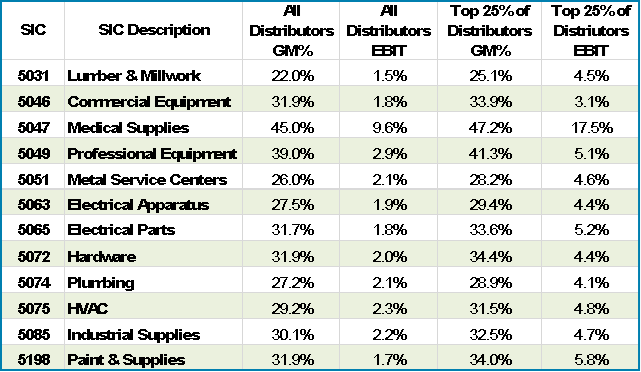
Annual financial statement studies consistently show that 25% of distributors earn far more than the average company in their industry. These firms’ earnings are 3 to 4 times higher than the average firm. As you review the details, you find these companies do not have an advantage when it comes to expense management. Their overhead as a percentage of sales is about average. The key difference is their gross margins…these companies enjoy gross margin rates that are +1.5 to +2.3 points higher than their peers.
Why Some Make More
We believe the most profitable distributor’s margin advantage is largely traceable to how they price their least price sensitive sales. When you review distributor pricing you see two key trends…
There is little difference in how distributors price higher volume items
There is significant difference in how distributors price incidentals
When you examine pricing on frequently purchased, higher volume items by industry; you see that the resulting margin rate from distributor to distributor is very similar. The most and least profitable companies price competitive items about the same.
The big difference is the margin rates on about 33% of their sales…the low volume, infrequent purchases made by their customers. Here you find a big difference.
Key Benchmarks
Two benchmark measurements have a strong correlation to margin optimization on incidental sales. Both of those benchmarks are measurements of Margin Point Differentiation. The first benchmark is the margin point difference between infrequently purchased items and a distributors average gross margin. The second benchmark is similar; the margin point difference between items your customers spends less than $250 a year on and the distributors average gross margin.
In our analysis, the average distributor had a 7-point difference between their average margin and the margin on customer-item combinations purchased three or less times annually. The most profitable distributors average a 14-point difference. The difference between the average margin and the margin on customer item combinations on which the customer spent less than $250 a year is 8 points for the average distributor. The 25% of distributors with the highest earnings enjoy a 15-point difference.
How Distributors Optimize Margin
Higher incidental sale margins are not accidental. Too many distribution executives focus almost exclusively on pricing high volume sales to their larger customers. Top-performing distributors are very systematic in their approach to pricing incidental sales. When you study how top performing companies price incidentals you find they excel at these important practices…
- Executives Take Strategic Control over Pricing “Incidental Sales”
- They Price Based on How Frequently Each Customer Buys an Item and How Much They Spend Over Time
- They Understand How to Use Their Pricing Software to Optimize Margin
- Their Systems Provide the Optimal Margin at Order Entry for Any Purchase
- They Make Sure Their Sales Force Uses System Pricing. They Set Metrics, Carefully Measure and Pay Based on Price Utilization and Incremental Margin
Contact Us or call (913) 897-0159 for additional information on how you too can safely increase margin. Ask to schedule an executive briefing.


